 返回
返回顶部
The Mobile Web Simulator can be used for both previewing an app during development, and for browsing the web to view apps or sites on the Internet. Using the simulator, you can view apps on different devices, change the orientation, test device movement, such as shaking or rotating, test geolocation changes, and test the effects of various stages of battery life.
Note: Accelerometer, geolocation, battery life, and platform event tests require the use of PhoneGap APIs in your app.
The Mobile Web Simulator is based on the Chrome browser using the same WebKit rendering engine as iOS and Android. The simulator emulates the Cordova 2.0 API and supports previews for iPhone, iPad, Nexus S, Kindle Fire 7″, and Samsung Tab 10.1 devices.
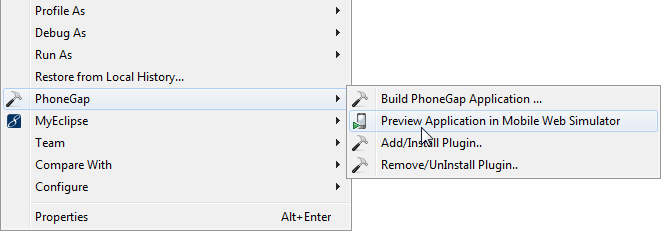
To open a project application for testing, right-click the project in the Explorer, and select PhoneGap>Preview Application in Mobile Web Simulator.
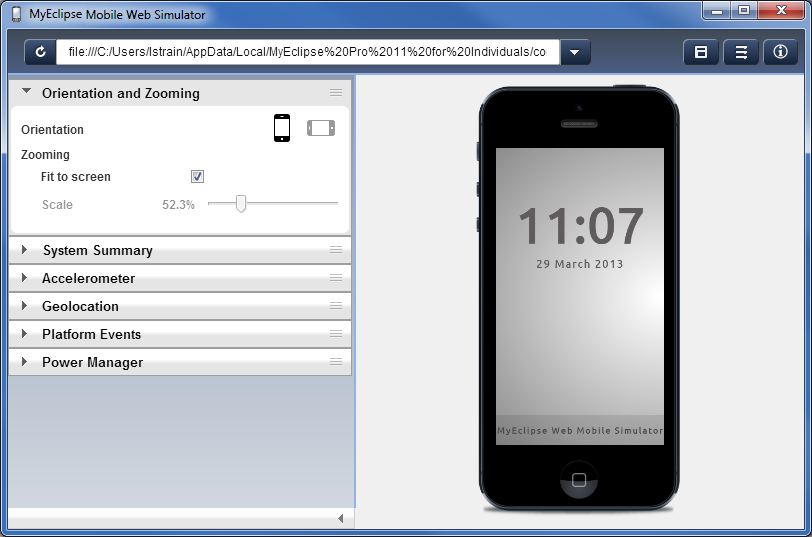
Project applications can be run and tested in the simulator. In addition, you can use the simulator to browse the Internet and run mobile applications from the web.
Using the Mobile Web Simulator preferences, you can set a home page that appears in the device when you open the Mobile Web Simulator from the toolbar icon ![]() .
.
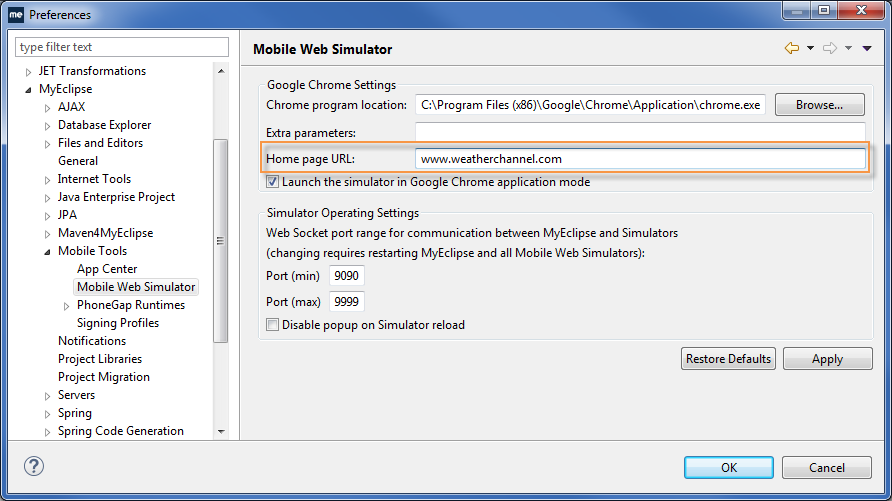
Note: The Mobile Web Simulator preference page also allows you to enter the path to your Google Chrome installation. If you receive an error that Chrome cannot be found when you try to open the simulator, open the preference page and set the path to the Chrome browser.
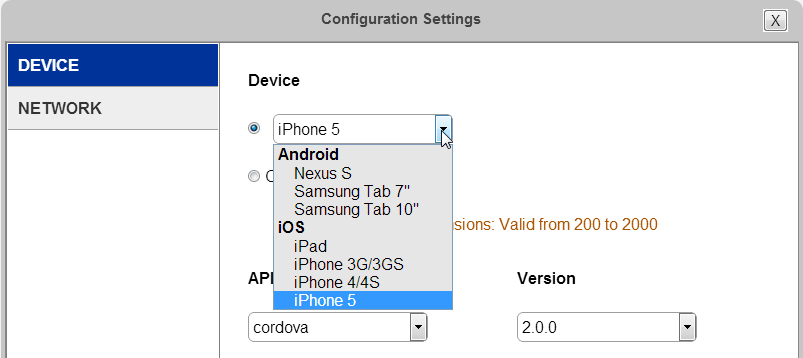
The Mobile Web Simulator supports simulation for iPhone, iPad and multiple Android devices. You can change the device view to see how apps appear on any supported device, as well as in either landscape or portrait orientation.
With the simulator open, click ![]() , select the device you want to view from the Device drop-down, and click Done. You can also set a custom size by entering custom height and width dimensions.
, select the device you want to view from the Device drop-down, and click Done. You can also set a custom size by entering custom height and width dimensions.
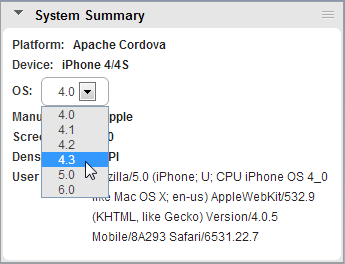
Change the operating system version by opening the System Summary panel and selecting a version from the OS drop-down list.
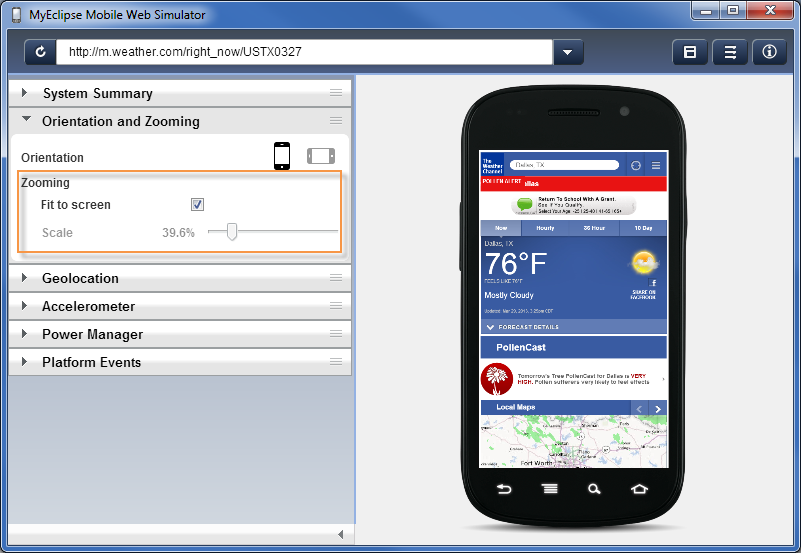
You can set the scaling of the device in the simulator window. Open the Orientation and Zooming panel, and drag the slider to select a scaling percentage. Select the Fit to Screen checkbox to fit the device in the window.
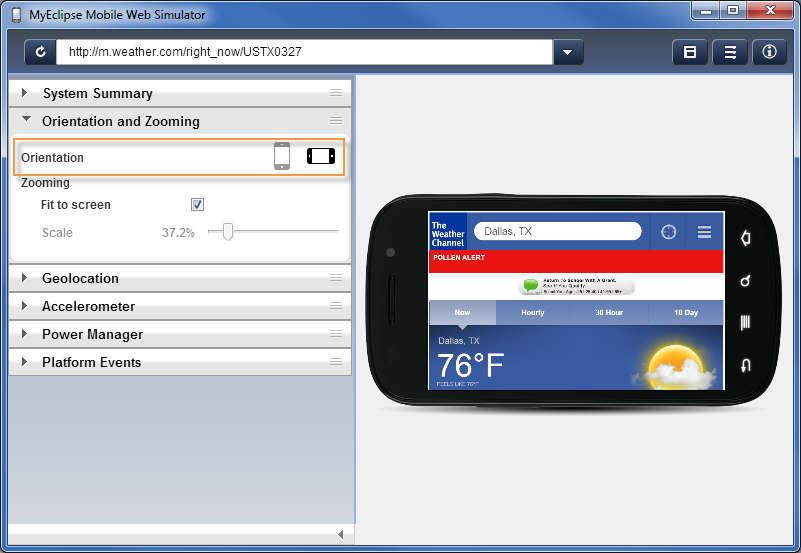
When designing an application, you want to consider the screen orientations of the device. If you are designing an application to run in both portrait and landscape, you want to test both orientations.
To rotate the device screen in the simulator, open the Orientation and Zooming panel, and click the orientation you want to view.
The PhoneGap Build Service creates a hybrid app from your mobile project using the PhoneGap runtime and API. This runtime includes the JavaScript cordova.js API and is available to your iOS and Android applications. Visit the Apache Cordova project for project information and API documentation.
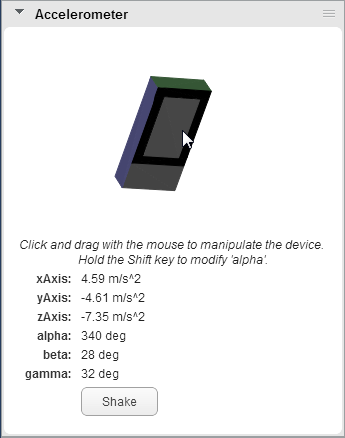
The accelerometer measures device movement speed, which allows detection of the device’s orientation, roll, pitch and yaw. A Shake button allows you to test how shaking the device affects your app. Simulating movement with the accelerometer provides information to apps that use the Accelerometer API.
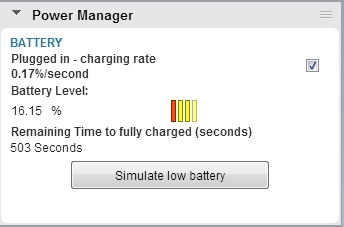
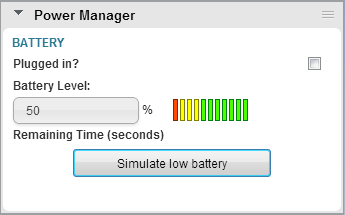
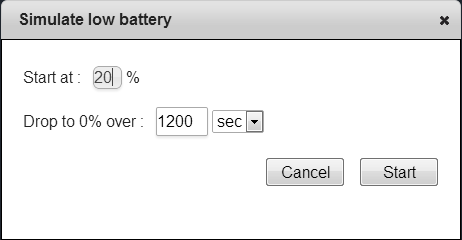
By simulating various battery power states, you can test the effects on your app. Test the results when the device is plugged in, with a low battery, or test at various battery level percentages. Simulating battery power provides information to apps that use the battery-related events of Events API.
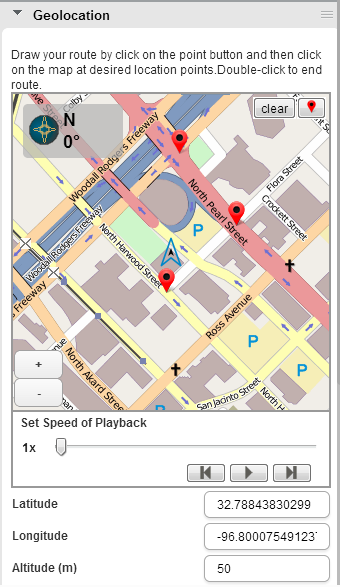
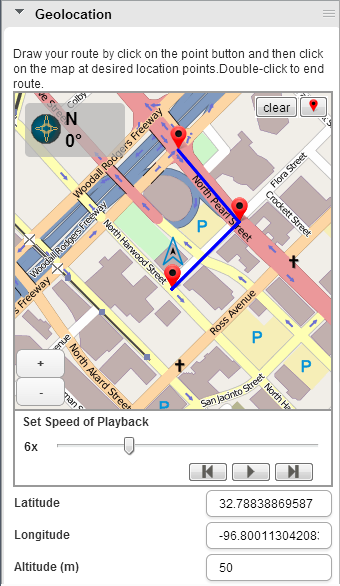
The Geolocation panel allows you to test changes to the physical location of the device, including moving along a route. Running a route simulation provides geolocation information to apps that use the Geolocation API.
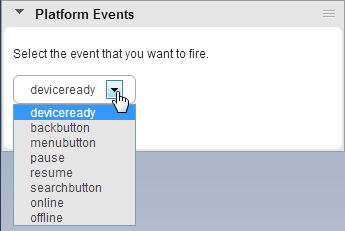
By firing simulating platform events, you can test the effects on apps that use the Events API.
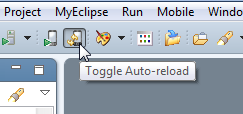
During development, you can hot sync your app changes with the simulator so you can leave the simulator open and test as you code. To automatically sync with the simulator, click ![]() on the MyEclipse toolbar.
on the MyEclipse toolbar.
The Mobile Web Simulator leverages the Chrome Developer Tools for debugging and inspecting your apps. Simply right-click the screen displayed in the device emulator, and select Inspect element to invoke the developer tools.
Learn more about the Chrome Developer Tools:
Guide – https://developers.google.com/chrome-developer-tools/
Videos – https://developers.google.com/chrome-developer-tools/docs/videos